Market Slide for Investors: Pitch Deck Success
The market slide is your pitch deck’s financial bedrock. It transforms product concepts into a compelling investment opportunity, communicating revenue potential and scalability. Investors, who review hundreds of pitches, hinge 67% of their decisions on addressable market size and growth projections. This slide proves your market understanding of revenue, customer acquisition, and competitive standing, validating product-market fit by demonstrating substantial market demand.
Professional investors focus on:
- TAM (total addressable market): the largest possible market for your product or service, encompassing all potential customers globally without current limitations.
- SAM (serviceable addressable market): a subset of tam that your product can realistically serve based on current geographic, demographic, or technological limitations.
- SOM (serviceable obtainable market): the specific market share you aim to capture within your sam over a defined timeframe, considering your strategy, resources, and competition.
They seek evidence of customer behavior supporting your assumptions and trends favoring rapid market expansion. Revenue model sustainability is crucial for long-term returns; investors assess willingness to pay and low churn. effective slides answer core questions: “how large is the opportunity?”, “what percentage can we capture?”, and “how fast will the market grow?” They also clarify customer acquisition costs, unit economics, and scaling mechanisms, and scrutinize market research methodology for accuracy, checking for primary research or authoritative sources.
Market Sizing Techniques
Market sizing methodology dictates investor confidence. Top-down market sizing uses broad industry data, often inflating figures. Bottom-up analysis builds from individual customer unit calculations, yielding more defensible and precise market projections.
The chosen method impacts investor confidence and valuation. Top-down figures are often discounted, while bottom-up analysis shows deeper market understanding and operational insight into customer acquisition and revenue generation. Investors prefer bottom-up because it proves you understand customer purchasing decisions and payment patterns, providing granular data for pricing and sales forecasting. It also leads to more reliable market projections for operational planning and boosts investor confidence in product-market fit. to implement it, define your target customer, research customer acquisition costs and purchase values, then calculate your total addressable market, adjusting for penetration and competition, and validate through interviews or pilot programs.
Market Slide Content
Essential content elements communicate opportunity scale while maintaining credibility. market metrics include total addressable market (tam), serviceable addressable market (sam), and serviceable obtainable market (som) calculations. Present metrics with standard units and timeframes, including multiple revenue scenarios (conservative, realistic, optimistic) for transparency.
Market trend analysis identifies forces driving market demand and expansion (demographics, regulations, technology). quantify their impact using growth rates and expansion projections. present trend data that supports your timing hypothesis. Customer insights sections show deep market needs and purchasing behaviors. include segment analysis, pain points, and willingness-to-pay research. present customer acquisition data, showing average customer lifetime value and retention. insights also reveal market segmentation and pricing validation, using data from interviews or surveys.
Market Slide Design
Professional market slide design enhances credibility and investor comprehension. a professional layout uses consistent formatting, uniform margins, and clear information hierarchy, placing key metrics prominently. white space utilization prevents overload. use simple graphics like bar charts for comparisons and line graphs for trends, with appropriate color coding. Data visualization must be accurate and proportional. Cohesive branding reinforces company identity and professionalism. use readable sans-serif fonts like arial, helvetica, or calibri for body text (16+ points minimum) and ensure font size hierarchy. balanced spacing with consistent margins and whitespace improves readability and guides investor attention.
Common Market Slide Mistakes:
- overestimating figures: inflated market projections signal inexperience, damaging credibility. conservative estimates with upside potential are preferred.
- generic data: non-customized industry reports show insufficient market understanding. customize analysis to your unique value proposition.
- ignoring external factors: failing to account for economic conditions, regulatory shifts, or competitive threats suggests inadequate risk assessment.
- no urgency: a lack of “why now” reduces investor motivation. show catalysts driving immediate purchasing decisions within your market.
- top-down pitfalls: this sizing approach often yields unrealistic market projections that ignore practical customer acquisition and scaling limitations. Investors prefer bottom-up analysis.
Market Slide Examples
Analyzing successful market slides offers practical insights into creating compelling investor presentations that effectively demonstrate market opportunity. These examples highlight how different companies effectively quantified their unique market positions:
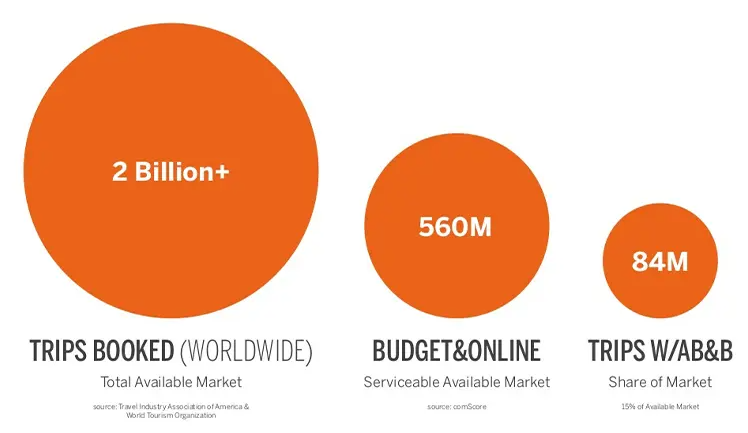
- Airbnb: exemplified effective bottom-up sizing by analyzing hotel industry pricing and occupancy data alongside target customer travel patterns. Their slide showcased growing demand for alternative accommodation and quantified the addressable market through specific customer segment analysis (Source).
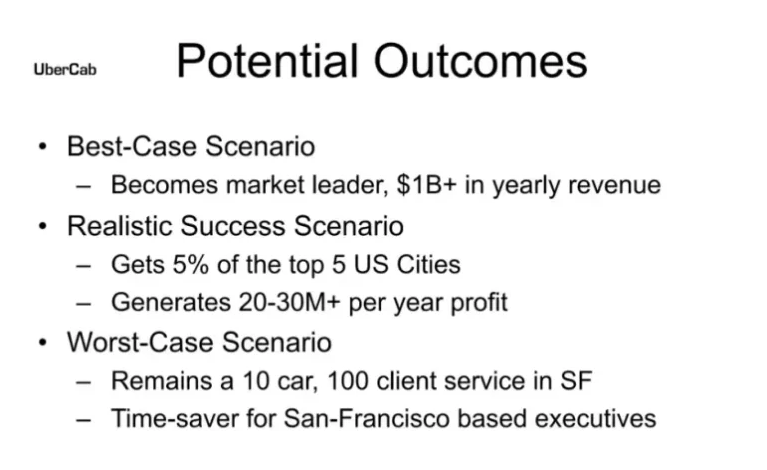
- Uber: focused on transportation spending patterns in major metropolitan areas, building market size estimates from taxi usage data and customer transportation budgets (Source).
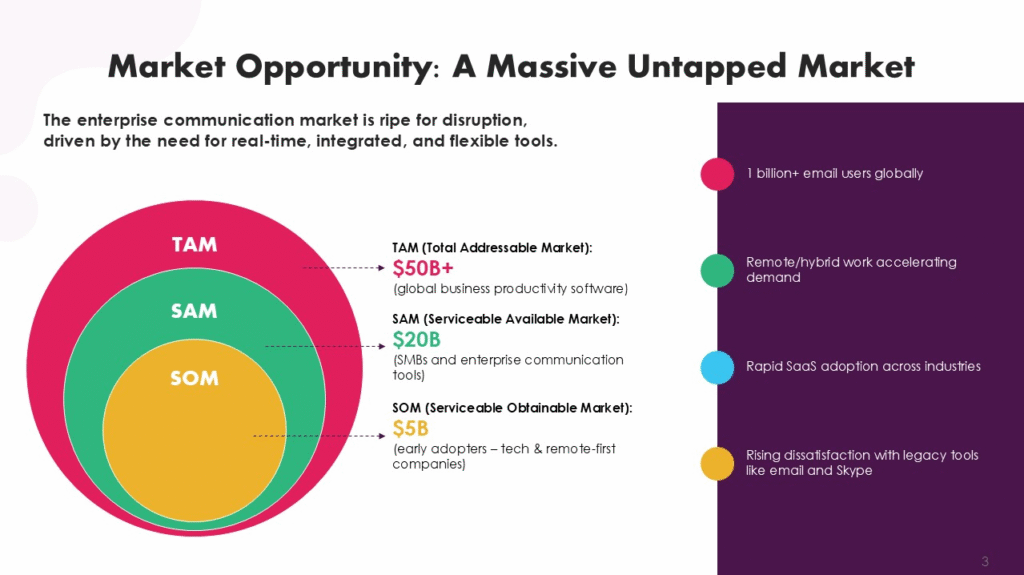
- Slack: their enterprise communication market slide combined bottom-up employee communication data with productivity software spending analysis (Source).
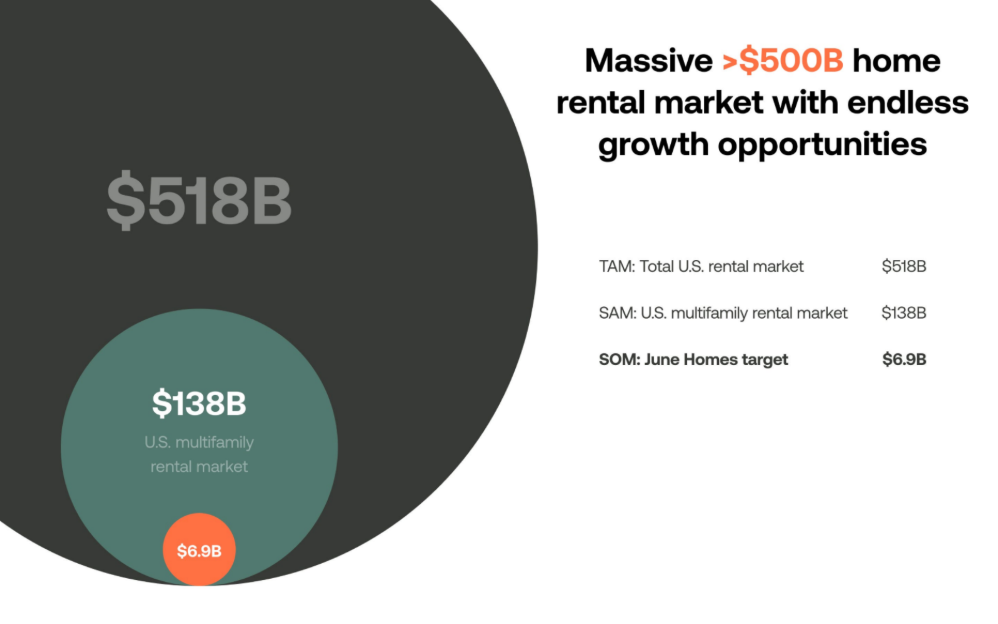
- June Homes: showed effective market sizing through detailed customer analysis and unit economics calculations. their presentations illustrated tam based on specific customer segments multiplied by annual software spending patterns within target industries (Source).